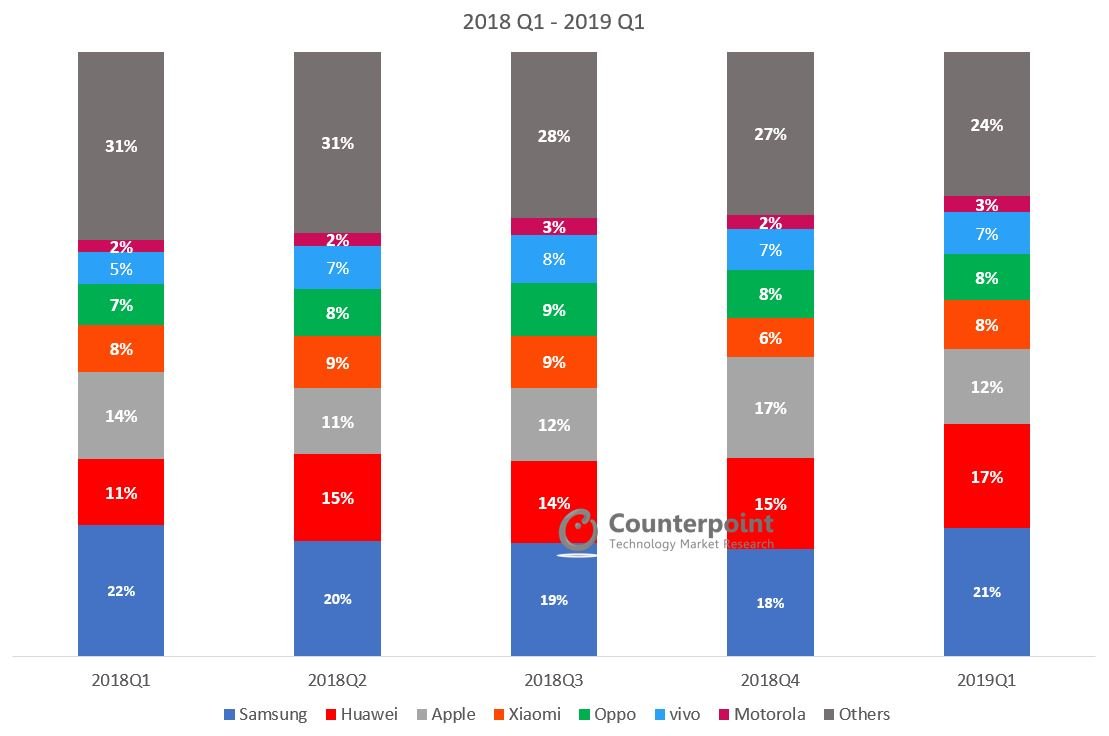
Data on this page is updated every quarter
This data represents the Global smartphone market share by quarter (from 2017-2019) by top OEMs. Global smartphone shipments by market share and millions of units is provided.
For detailed insights on the data, please reach out to us at contact(at)counterpointresearch.com. If you are a member of the press, please contact us at press(at)counterpointresearch.com for any media enquiries.
Q3 2019 Highlights
- The top three brands, Samsung, Huawei and Apple, together cornered almost half of the smartphone market, with the rest of the market left for hundreds of other brands to compete fiercely.
- Samsung continued its growth at 8.4% YoY, capturing over one-fifth of the global smartphone market. This is due to strong Note 10 and Galaxy A series sales.
- Huawei grew a very healthy 28.5% YoY globally. It captured a record 40% market share in the Chinese smartphone market.
- Apple iPhone shipments were down 4%, and as a result revenues fell 11% YoY.
- Realme remained the fastest-growing brand for the second time.
- BBK Group (OPPO, Vivo, Realme, and OnePlus) is close to becoming the largest smartphone manufacturer group globally, accounting for over 20% of the global smartphone market and three of its brands in the top 10.
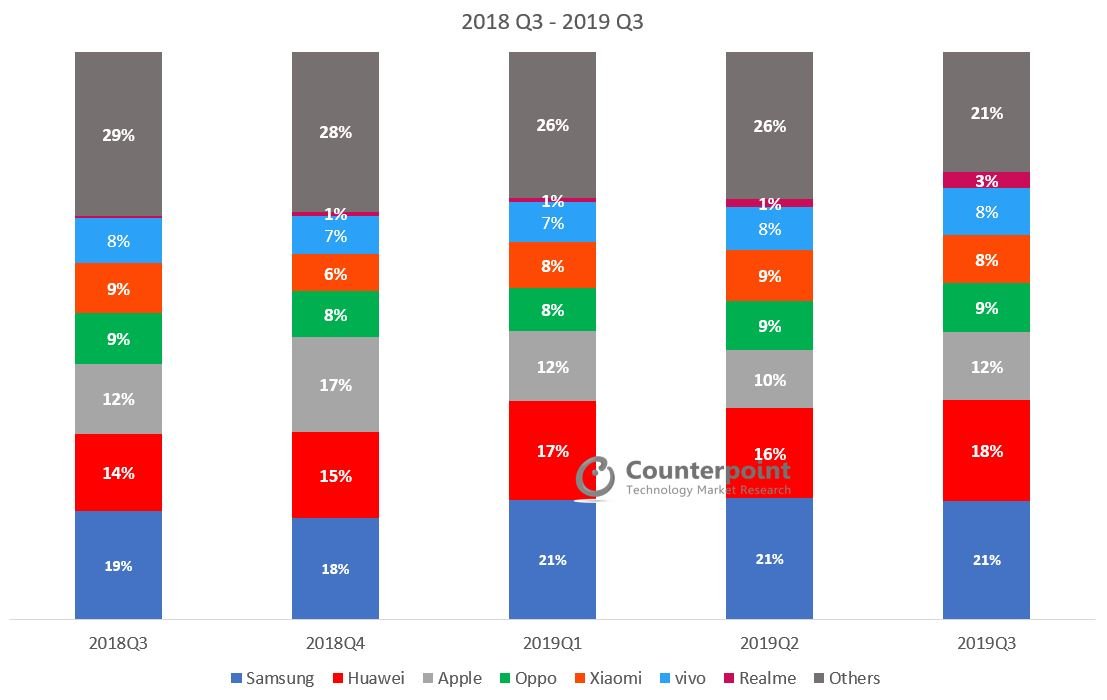
Source: MOBILE DEVICES MONITOR – Q3 2019 (Vendor Region Countries)
[Global Smartphone Share(%)]
| Global Smartphone Shipments Market Share (%) | 2018
Q3 |
2018
Q4 |
2019
Q1 |
2019
Q2 |
2019
Q3 |
| Samsung | 19% | 18% | 21% | 21% | 21% |
| Huawei# | 14% | 15% | 17% | 16% | 18% |
| Apple | 12% | 17% | 12% | 10% | 12% |
| Oppo | 9% | 8% | 8% | 9% | 9% |
| Xiaomi | 9% | 6% | 8% | 9% | 8% |
| vivo | 8% | 7% | 7% | 8% | 8% |
| Realme | 0% | 1% | 1% | 1% | 3% |
| Others | 29% | 28% | 26% | 26% | 21% |
[Global Smartphone Shipments (Millions of Units)]
| Global Smartphone Shipments | 2018Q3 | 2018Q4 | 2019Q1 | 2019Q2 | 2019Q3 |
| Samsung | 72.3 | 69.8 | 72.0 | 76.3 | 78.2 |
| Huawei# | 52.0 | 59.7 | 59.1 | 56.6 | 66.8 |
| Apple | 46.9 | 65.9 | 42.0 | 36.5 | 44.8 |
| Oppo | 33.9 | 31.3 | 25.7 | 30.6 | 32.3 |
| Xiaomi | 33.3 | 25.6 | 27.8 | 32.3 | 31.7 |
| vivo | 30.5 | 26.5 | 23.9 | 27.0 | 31.3 |
| Realme | 1.2 | 3.3 | 2.8 | 5.0 | 10.2 |
| Others | 109.7 | 112.6 | 87.7 | 92.8 | 84.7 |
#Huawei includes HONOR.
*Ranking is according to latest quarter.
Click here to read the about global smartphone market in Q3 2019.
Q2 2019 Highlights
- Samsung grew 7.1% YoY, capturing over one-fifth of the global smartphone market share.
- Huawei grew 4.6% YoY, but the US trade ban will its growth momentum, especially in the overseas market.
- Apple iPhone shipments fell 11%, and iPhone revenues fell 12% year-on-year.
- Realme entered the top 10 OEMs globally for the first time. It took Realme only a year to achieve this feat.
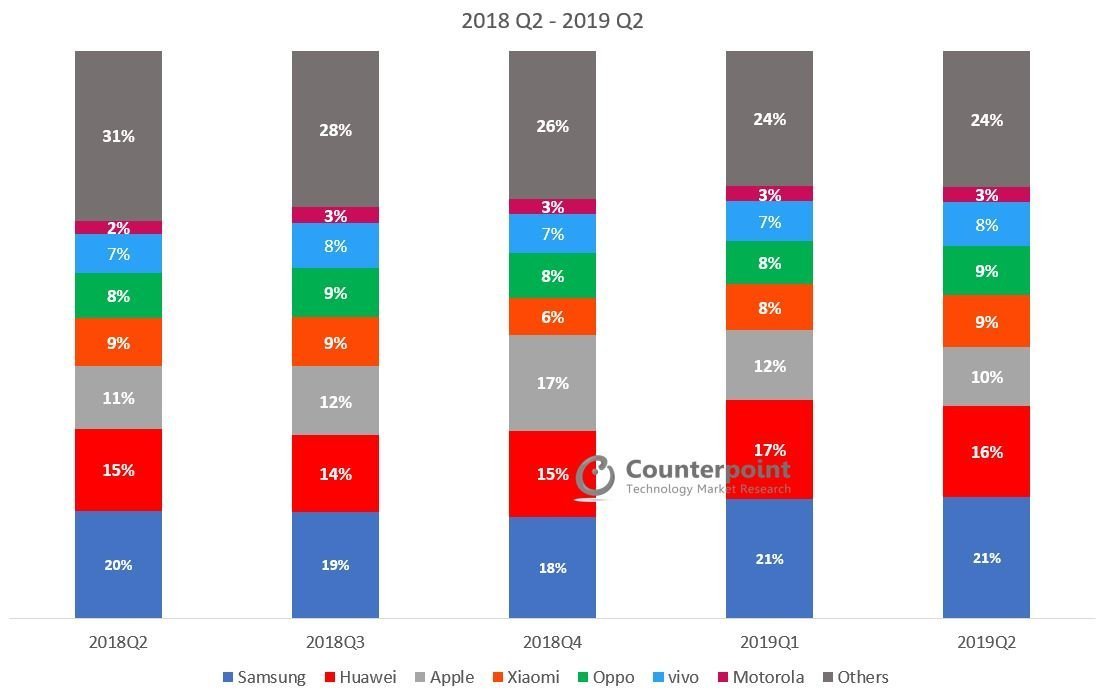 Source: Counterpoint Research Source: Market Monitor
[Global Smartphone Share(%)]
| Global Smartphone Shipments Market Share (%) | 2018
Q2 |
2018
Q3 |
2018
Q4 |
2019
Q1 |
2019
Q2 |
| Samsung | 20% | 19% | 18% | 21% | 21% |
| Huawei# | 15% | 14% | 15% | 17% | 16% |
| Apple | 11% | 12% | 17% | 12% | 10% |
| Xiaomi | 9% | 9% | 6% | 8% | 9% |
| Oppo | 8% | 9% | 8% | 8% | 9% |
| vivo | 7% | 8% | 7% | 7% | 8% |
| Lenovo** | 2% | 3% | 3% | 3% | 3% |
| Others | 31% | 28% | 26% | 24% | 24% |
[Global Smartphone Shipments (Millions of Units)]
| Global Smartphone Shipments | 2018
Q2 |
2018
Q3 |
2018
Q4 |
2019
Q1 |
2019
Q2 |
| Samsung | 71.5 | 72.3 | 69.8 | 72.0 | 76.3 |
| Huawei# | 54.2 | 52.0 | 59.7 | 59.1 | 56.6 |
| Apple | 41.3 | 46.9 | 65.9 | 42.0 | 36.5 |
| Xiaomi | 32.0 | 33.3 | 25.6 | 27.8 | 32.3 |
| Oppo | 29.6 | 33.9 | 31.3 | 25.7 | 30.6 |
| vivo | 26.5 | 30.5 | 26.5 | 23.9 | 27.0 |
| Lenovo** | 9.0 | 11.0 | 10.1 | 9.5 | 9.5 |
| Others | 100.2 | 99.9 | 105.7 | 81.0 | 85.2 |
#Huawei includes HONOR.
**Lenovo includes Motorola.
*Ranking is according to latest quarter.
Q1 2019 Highlights
- Overall smartphone shipment declined 5% in Q1 2019, Sixth consecutive quarter of shipments falling.
- Samsung recorded an increase in revenue as Galaxy S10 flagship smartphones did better than Galaxy S9 at the time of launch.
- Apple iPhone shipments declined year-over-year for the second consecutive quarter.
- Xiaomi smartphone shipments declined annually as it faces tough competition in the China market.
Source: Counterpoint Research Market Monitor
[Global Smartphone Share(%)]
| Global Smartphone Shipments Market Share (%) | 2018
Q1 |
2018
Q2 |
2018
Q3 |
2018
Q4 |
2019
Q1 |
| Samsung | 22% | 20% | 19% | 18% | 21% |
| Huawei# | 11% | 15% | 14% | 15% | 17% |
| Apple | 14% | 11% | 12% | 17% | 12% |
| Xiaomi | 8% | 9% | 9% | 6% | 8% |
| Oppo | 7% | 8% | 9% | 8% | 8% |
| vivo | 5% | 7% | 8% | 7% | 7% |
| Motorola | 2% | 2% | 3% | 2% | 3% |
| Others | 31% | 31% | 28% | 27% | 24% |
[Global Smartphone Shipments (Millions of Units)]
| Global Smartphone Shipments | 2018
Q1 |
2018
Q2 |
2018
Q3 |
2018
Q4 |
2019
Q1 |
| Samsung | 78.2 | 71.5 | 72.3 | 69.8 | 72.0 |
| Huawei# | 39.3 | 54.2 | 52.0 | 59.7 | 59.1 |
| Apple | 52.2 | 41.3 | 46.9 | 65.9 | 42.0 |
| Xiaomi | 28.1 | 32.0 | 33.3 | 25.6 | 27.8 |
| Oppo | 24.2 | 29.6 | 33.9 | 31.3 | 25.7 |
| vivo | 18.9 | 26.5 | 30.5 | 26.5 | 23.9 |
| Motorola | 7.6 | 8.3 | 10.6 | 9.5 | 8.9 |
| Others | 113.1 | 100.9 | 100.4 | 106.4 | 81.6 |
#Huawei includes HONOR.
*Ranking is according to latest quarter.
Q4 2018 Highlights
- Q4 2018 smartphone shipments declines 7%; Fifth consecutive quarter of smartphone decline
- For Q4 2018, Huawei, OPPO and vivo continue to dominate with strong performances in China, India, Asia and parts of Europe. The trio have multiple regions to enter and grow moving forward into 2019.
- Samsung and Apple saw a tough quarter and tough 2018 as demand for their flagship phones have waned due to competition from affordable premium and more cutting-edge phones from Chinese brands such as Huawei and OnePlus.
- Xiaomi reached a record fourth position for the full year after two years of setbacks thanks to immense growth in India. It has surpassed OPPO globally to take back the fourth position.
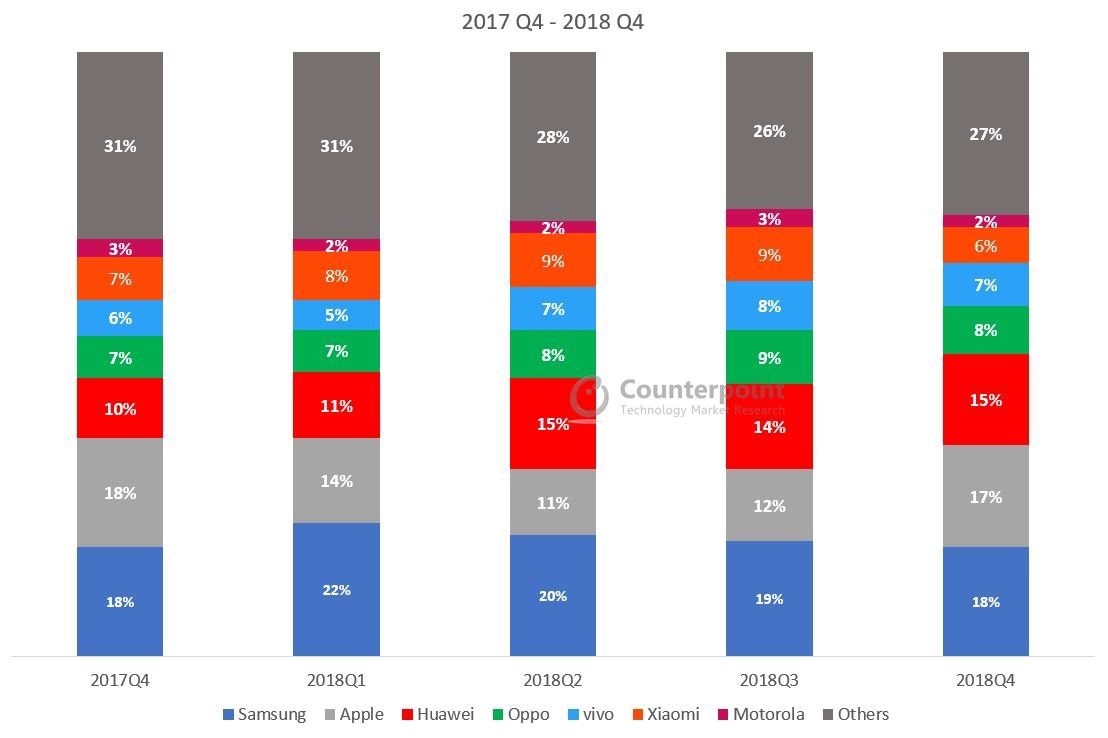 Source: Counterpoint Research Market Monitor
[Global Smartphone Share(%)]
| Global Smartphone Shipments Market Share (%) | 2017
Q4 |
2018
Q1 |
2018
Q2 |
2018
Q3 |
2018
Q4 |
| Samsung | 18% | 22% | 20% | 19% | 18% |
| Apple | 18% | 14% | 11% | 12% | 17% |
| Huawei | 10% | 11% | 15% | 14% | 15% |
| Oppo | 7% | 7% | 8% | 9% | 8% |
| vivo | 6% | 5% | 7% | 8% | 7% |
| Xiaomi | 7% | 8% | 9% | 9% | 6% |
| Motorola | 3% | 2% | 2% | 3% | 2% |
| Others | 31% | 31% | 28% | 26% | 27% |
[Global Smartphone Shipments (Millions of Units)]
| Global Smartphone Shipments | 2017
Q4 |
2018
Q1 |
2018
Q2 |
2018
Q3 |
2018
Q4 |
| Samsung | 74.4 | 78.2 | 71.5 | 72.3 | 69.8 |
| Apple | 77.3 | 52.2 | 41.3 | 46.9 | 65.9 |
| Huawei | 41.0 | 39.3 | 54.2 | 52.0 | 59.7 |
| Oppo | 30.7 | 24.2 | 29.6 | 33.9 | 31.3 |
| vivo | 24.0 | 18.9 | 26.5 | 30.5 | 26.5 |
| Xiaomi | 31.0 | 28.1 | 32.0 | 33.3 | 25.6 |
| Motorola | 10.9 | 7.6 | 8.3 | 10.6 | 9.5 |
| Others | 134.8 | 113.1 | 100.9 | 100.4 | 106.4 |
*Ranking is according to latest quarter.
Q3 2018 Highlights
- The top 10 players now capture 79% of the market leaving 600+ brands to compete for the remaining 21% of the market.
- iPhone helped Apple to record 3rd quarter revenue even as shipments remain flat YoY.
- Samsung continued to lead the smartphone market with 19% market share in the quarter.
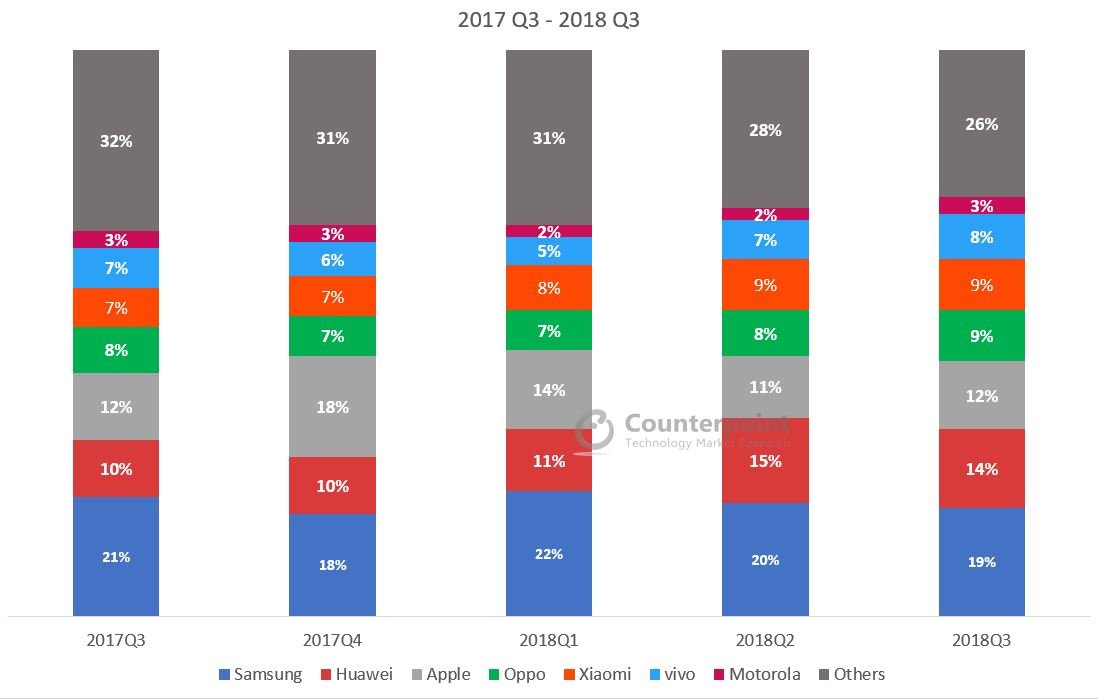
Source: Counterpoint Research Market Monitor
[Global Smartphone Share(%)]
| Global Smartphone Shipments Market Share (%) | 2017
Q3 |
2017
Q4 |
2018
Q1 |
2018
Q2 |
2018
Q3 |
| Samsung | 21% | 18% | 22% | 20% | 19% |
| Huawei | 10% | 10% | 11% | 15% | 14% |
| Apple | 12% | 18% | 14% | 11% | 12% |
| Oppo | 8% | 7% | 7% | 8% | 9% |
| Xiaomi | 7% | 7% | 8% | 9% | 9% |
| vivo | 7% | 6% | 5% | 7% | 8% |
| Motorola | 3% | 3% | 2% | 2% | 3% |
| Others | 32% | 31% | 31% | 28% | 26% |
[Global Smartphone Shipments (Millions of Units)]
| Global Smartphone Shipments | 2017
Q3 |
2017
Q4 |
2018
Q1 |
2018
Q2 |
2018
Q3 |
| Samsung | 83.3 | 74.4 | 78.2 | 71.5 | 72.3 |
| Huawei | 39.1 | 41.0 | 39.3 | 54.2 | 52.0 |
| Apple | 46.7 | 77.3 | 52.2 | 41.3 | 46.9 |
| Oppo | 32.5 | 30.7 | 24.2 | 29.6 | 33.9 |
| Xiaomi | 28.5 | 31.0 | 28.1 | 32.0 | 33.3 |
| vivo | 28.6 | 24.0 | 18.9 | 26.5 | 30.5 |
| Motorola | 12.5 | 10.9 | 7.6 | 8.3 | 10.6 |
| Others | 127.6 | 134.8 | 113.1 | 101.0 | 100.4 |
*Ranking is according to latest quarter.
Q2 2018 Highlights
- Smartphone shipments declined 2% annually to 360 million units in Q2 2018.
- The top 10 brands accounted for 79% of the smartphone volumes in Q2 2018.
- Samsung led the smartphone market by volume with a market share of 20% in Q2 2018 even though it registered an annual decline of 11% due to weak sales of its flagship Galaxy S9 series smartphones.
- Huawei shipments grew 41% annually in Q2 2018. The company managed to be the fastest growing (21%) smartphone brand amid a declining China smartphone market and grew fully 71% overseas.
- Apple shipped 41.3 million iPhones during Q2 2018, up 1% compared to the same quarter last year. iPhone X remains the top seller for Apple during the quarter.
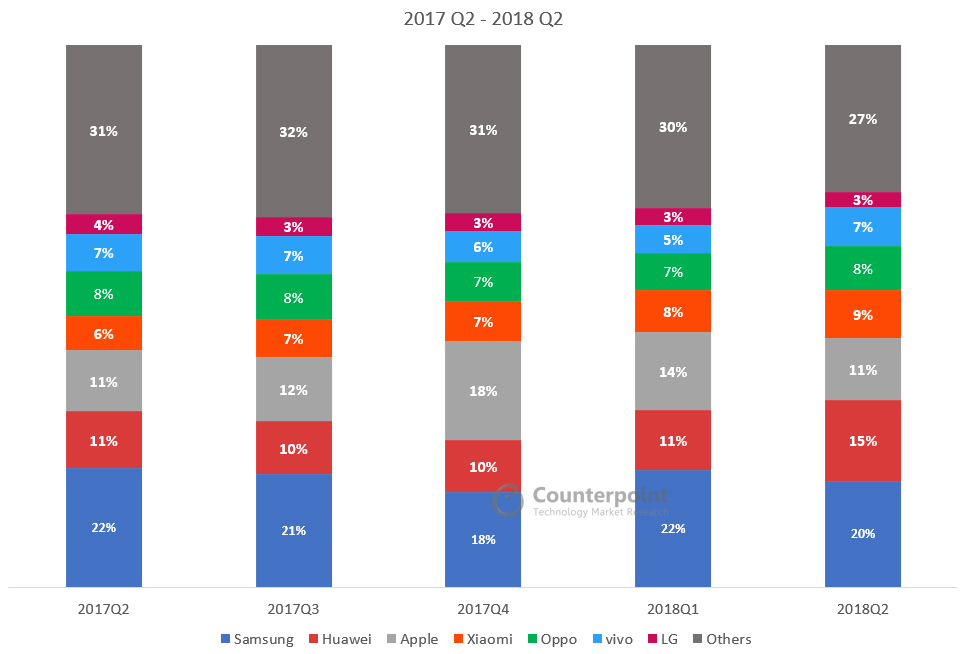 Source: Counterpoint Research Market Monitor
[Global Smartphone Share(%)]
| Global Smartphone Shipments Market Share (%) | 2017
Q2 |
2017
Q3 |
2017
Q4 |
2018
Q1 |
2018
Q2 |
| Samsung | 22% | 21% | 18% | 22% | 20% |
| Huawei | 11% | 10% | 10% | 11% | 15% |
| Apple | 11% | 12% | 18% | 14% | 11% |
| Xiaomi | 6% | 7% | 7% | 8% | 9% |
| Oppo | 8% | 8% | 7% | 7% | 8% |
| vivo | 7% | 7% | 6% | 5% | 7% |
| LG | 4% | 3% | 3% | 3% | 3% |
| Others | 31% | 32% | 31% | 30% | 27% |
[Global Smartphone Shipments (Millions of Units)]
| Global Smartphone Shipments | 2017
Q2 |
2017
Q3 |
2017
Q4 |
2018
Q1 |
2018
Q2 |
| Samsung | 80.4 | 83.3 | 74.4 | 78.2 | 71.5 |
| Huawei | 38.5 | 39.1 | 41.0 | 39.3 | 54.2 |
| Apple | 41.0 | 46.7 | 77.3 | 52.2 | 41.3 |
| Xiaomi | 23.1 | 28.5 | 31.0 | 28.1 | 32.0 |
| Oppo | 30.5 | 32.5 | 30.7 | 24.2 | 29.6 |
| vivo | 24.8 | 28.6 | 24.0 | 18.9 | 26.5 |
| LG | 13.3 | 13.9 | 13.9 | 11.4 | 9.8 |
| Others | 113.9 | 126.3 | 131.8 | 109.3 | 99.5 |
*Ranking is according to latest quarter.
Q1 2018 Highlights
- Smartphone shipments declined 3% annually reaching 360 million units in Q1 2018.
- The China market decline in Q1 2018, affected the overall growth of some of the key Chinese brands including OPPO and vivo. Both saw a decline in the quarter as a result of the China market slowdown.
- Smartphone penetration fell to 76% of all the mobile phones shipped in the quarter. This was partly due to an increase in feature phone shipments by some key brands such as Nokia HMD and Reliance Jio who both saw YoY growth.
- Top 10 brands accounted for 76% of the smartphone volumes in Q1 2018.
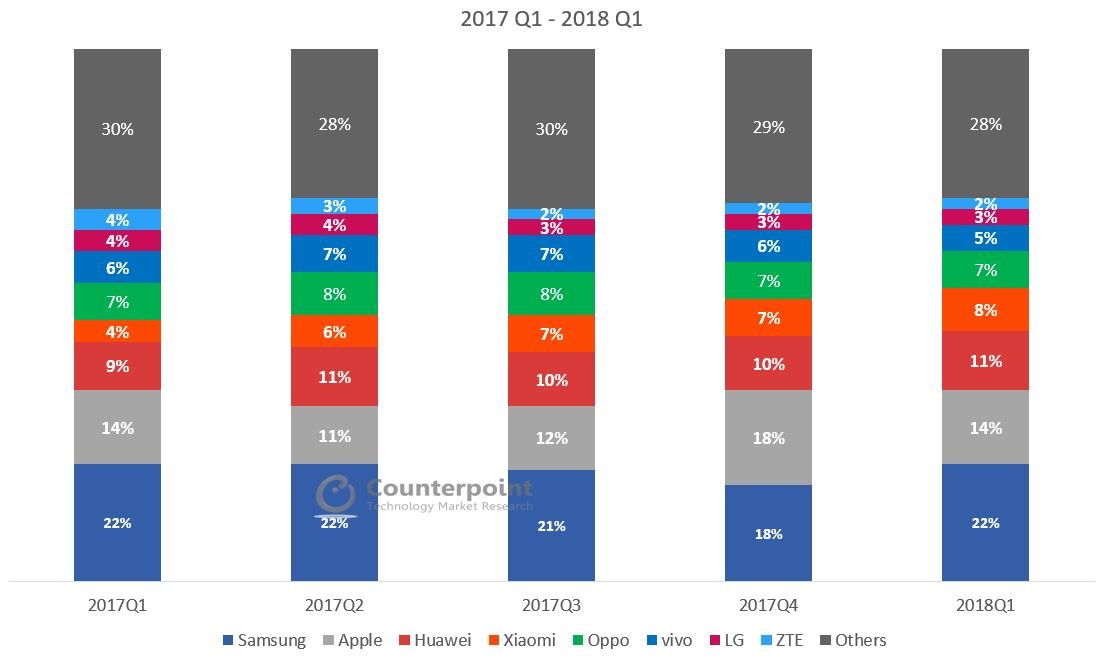 Source: Counterpoint Research Market Monitor
[Global Smartphone Share(%)]
| Global Smartphone Shipments Market Share (%) | 2017
Q1 |
2017
Q2 |
2017
Q3 |
2017
Q4 |
2018
Q1 |
| Samsung | 22% | 22% | 21% | 18% | 22% |
| Apple | 14% | 11% | 12% | 18% | 14% |
| Huawei | 9% | 11% | 10% | 10% | 11% |
| Xiaomi | 4% | 6% | 7% | 7% | 8% |
| Oppo | 7% | 8% | 8% | 7% | 7% |
| vivo | 6% | 7% | 7% | 6% | 5% |
| LG | 4% | 4% | 3% | 3% | 3% |
| ZTE | 4% | 3% | 2% | 2% | 2% |
| Others | 30% | 28% | 30% | 29% | 28% |
[Global Smartphone Shipments (Millions of Units)]
| Global Smartphone Shipments | 2017
Q1 |
2017
Q2 |
2017
Q3 |
2017
Q4 |
2018
Q1 |
| Samsung | 80.0 | 80.4 | 83.3 | 74.4 | 78.2 |
| Apple | 50.8 | 41.0 | 46.7 | 77.3 | 52.2 |
| Huawei | 34.6 | 38.5 | 39.1 | 41.0 | 39.3 |
| Xiaomi | 13.4 | 23.1 | 28.5 | 31.0 | 28.1 |
| Oppo | 26.1 | 30.5 | 32.5 | 30.7 | 24.2 |
| vivo | 22.8 | 24.8 | 28.6 | 24.0 | 18.9 |
| LG | 14.8 | 13.3 | 13.9 | 13.9 | 11.4 |
| ZTE | 13.3 | 12.2 | 9.8 | 9.4 | 7.1 |
| Others | 115.4 | 101.8 | 116.5 | 122.5 | 102.2 |

