Keep your front-end skills sharp and work through these challenges
There’s only one way to get good at coding and that is to code as often as possible. We coders wake up in the morning with the desire to code, but often lack the creative ideas about what to code.
The purpose of this article is to provide you with challenges so you can do what you love — coding!
Coding is a muscle that needs to be trained like any other muscle. Without further ado, here are five front-end challenges to get you up and running.

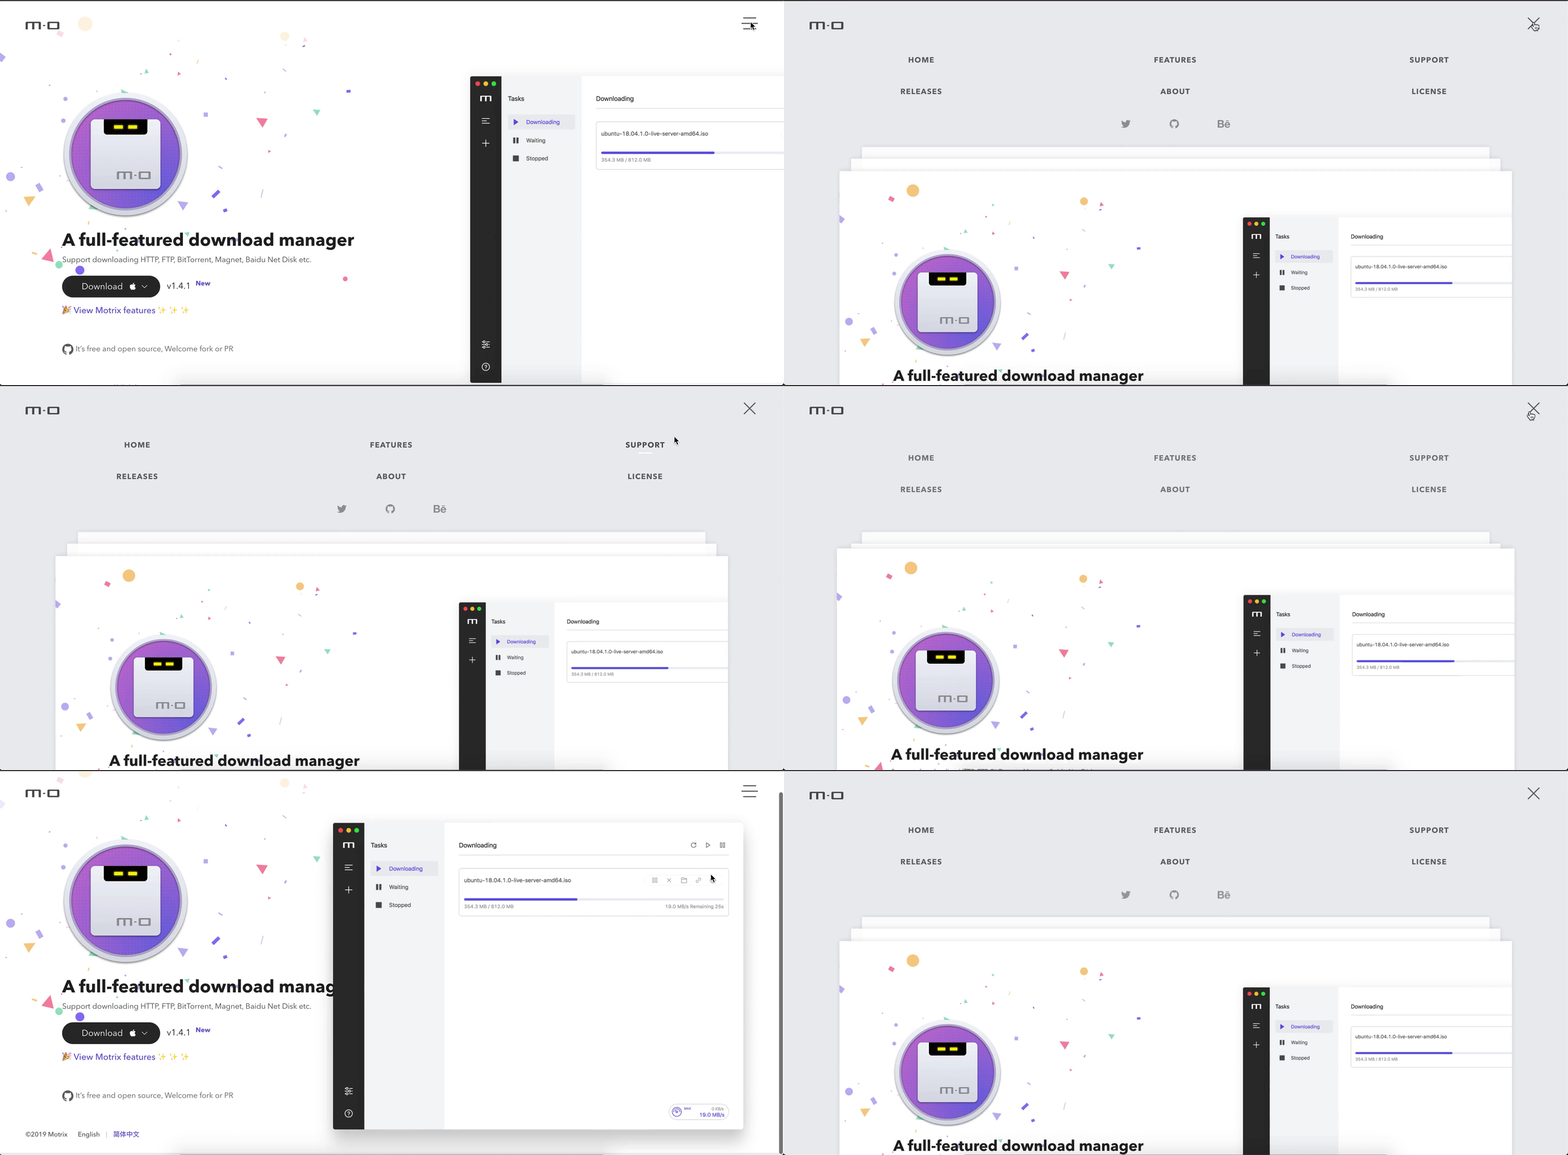
Watch as the content shrinks when you click on the menu — cool effect, right?!
What you will learn by completing this challenge
- CSS transitions and animations.
- How to reposition the layout and content.
- How to use HTML and JavaScript in harmony to add interactivity to your website.

A bubble chart is a type of chart that displays three dimensions of data. Each entity, with its triplet of associated data, is plotted as a disk that expresses two of the vᵢ values through the disk’s xy location and the third through its size.
What you will learn by completing this challenge
- How to use JavaScript to visualize data.
- Using CSS with JavaScript for transitions, styling, and interactivity.

What is an input mask?
Input masks are a way to control what data can be entered into a form’s field. They are governed by a strict set of rules that site visitors can’t break while trying to fill out your form.
What you will learn by completing this challenge
- How to use enforced strict rules for your forms and inputs.
- How to use JavaScript to validate forms.
- How to use CSS and JavaScript to create dynamic forms.
Read more about masked inputs at WPForms.

Vertical bar charts are useful when it comes to visualizing daily, weekly, monthly, or annual data. The example above shows the service uptime for each day.
What you will learn by completing this challenge
- How to use JavaScript to create vertical bar charts.
- How to use CSS to style charts.
- How to visualize data with JavaScript.

System metric charts are useful when it comes to visualizing sales, conversations, gross margins, crash reports, etc. The list goes on and on.
Every complex application will utilize system charts in some manner. It’s a solid idea to get your hands dirty early-on.
What you will learn by completing this challenge
- How to use JavaScript to create system charts.
- How to use CSS to style charts.
- How to visualize data with JavaScript.
I hope you’ve found this article useful and obtained new challenges to code.
Remember, coding is a difficult skill to master, therefore, you should be coding as much as possible. Any skill can be mastered with time, dedication, and perseverance. Thanks for reading!